The characteristic curve
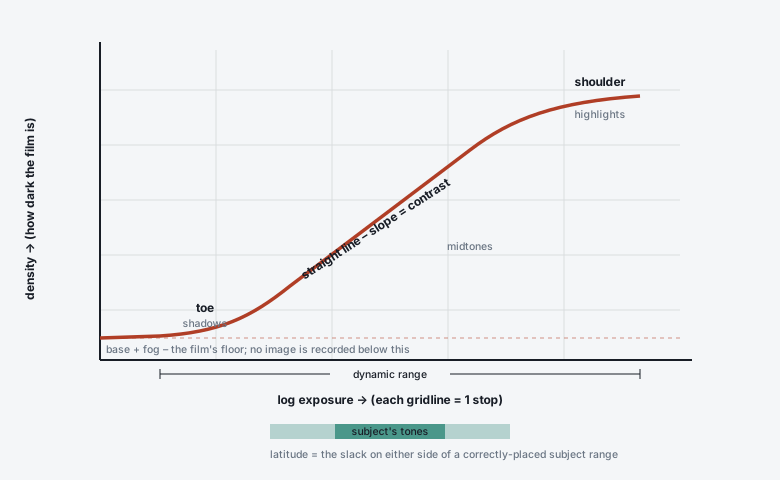
The characteristic curve (a.k.a. the H&D curve after Hurter & Driffield, or the D–logH curve) is the single most useful graph in photography. It plots how much the film darkens (density) against how much light it received (log exposure), and its shape is the film’s personality.
In short
x-axis: log exposure (log H). Logarithmic, so one unit of 0.3 = one stop.
y-axis: density (D). Also logarithmic: D 0.3 = ½ the light gets through, D 1.0 = 1/10, D 2.0 = 1/100.
Three regions: toe (shadows), straight line (midtones, slope = contrast), and shoulder (highlights).
Negative film: long straight line, gentle shoulder, everything rising left-to- right. Reversal (slide): mirror image – density falls as exposure rises – and much steeper.
Development moves the curve: more development pivots the straight line steeper and lifts Dmax, with little effect on the toe.
Building the curve
Expose a strip of film to a calibrated step-wedge (a row of patches each 1/3 or 1/2 stop apart), develop it normally, and read the density of each patch on a densitometer. Plot density vs the log of the exposure each patch got. You get an S-shape:
The regions, left to right
Region |
Where the tones land |
Behaviour |
|---|---|---|
Base + fog |
below everything |
The minimum density: the tint of the base plus spontaneously developed grains. ~0.2–0.5 for colour neg (the orange mask), <0.1 for a clear B&W base. No image information here – exposure below the toe is simply lost. |
Toe |
deep shadows |
Slope starts near zero and increases. Shadow contrast is compressed: two dark tones a stop apart may be nearly the same density. A long toe (Tri-X) = smooth, gradual shadows; a short toe (T-Max, most slide film) = shadows snap to black. |
Straight line |
midtones, most of the picture |
Constant slope. This slope is the film’s contrast (gamma / gradient). Equal stops → equal density steps → faithful tonal separation. |
Shoulder |
highlights |
Slope decreases again; highlights compress. Negative film’s shoulder is long and soft – you can pile 4–5 stops of overexposure in and still separate highlights. Slide film barely has one. |
Dmax |
brightest highlight (neg) / deepest black (slide) |
The maximum density the film can build. ~2.0–2.5 for B&W neg with normal dev; 3.5–4+ for slide film projected – that deep black is why slides look so punchy. |
Solarisation region |
extreme overexposure |
Far past the shoulder, density can decrease again (the Sabattier/solarisation effect). Not encountered in normal shooting. |
Reading real numbers off it
Speed point. For B&W (ISO 6) it is the exposure that gives D = 0.10 above base+fog, when the film is developed to a specified contrast. Slide it left (film needs less light) → higher ISO.
Gamma (γ) – slope of the straight-line part only:
γ = ΔD / Δ(logH)between two straight-line points.Contrast Index (CI) / average gradient (Ḡ) – slope of a line between two points on the real curve (one low in the toe, one high). More representative of pictures than γ because it includes the toe. A normal pictorial CI ≈ 0.56–0.62; contact-printing and alt-process work uses much higher.
Dmax / Dmin – the vertical extent, which combined with the slope tells you the dynamic range (horizontal extent between usable toe and usable shoulder).
Jargon buster
γ (gamma) – straight-line slope. Historically also “gamma infinity” (γ∞) = the highest contrast a film reaches with prolonged development. Ḡ / contrast index – a practical average slope over the range a real scene uses. “printed to a fixed gamma” – datasheets show several curves for different development times; pick the one matching your target contrast.
How development changes the curve
Key idea
Development pivots the straight line about a point low in the toe. More development → steeper slope (more contrast), higher Dmax, and a small speed gain. It does almost nothing to the deep shadows, because those grains barely reached threshold. Hence the mantra: expose for the shadows, develop for the highlights.
More time / higher temp / more agitation / more active developer → steeper curve, higher contrast, more grain, ~⅓ stop more speed before it plateaus.
Less development → flatter curve, lower contrast, cleaner grain, slight speed loss.
This is the mechanism behind push/pull (Pushing and pulling film) and the Zone System’s N+1 / N−1 – you are choosing a development to make the scene’s brightness range land neatly between paper black and paper white.
Negative vs reversal curves
Negative |
Reversal (slide) |
|
|---|---|---|
Direction |
density rises with exposure |
density falls with exposure (more light → clearer film → brighter on projection) |
Straight-line slope |
shallow, ~0.55–0.65 (it will be enlarged onto higher-contrast paper) |
steep, often >1.7 (it is the final image – no printing stage to add contrast) |
Shoulder / toe |
long soft shoulder, moderate toe → highlight latitude |
abrupt “wall” at both ends → ±½ stop latitude |
Dmax |
~2.0–2.5 (as a negative) |
3.5–4.0+ projected black |
Consequence |
forgives overexposure; protect shadows |
forgives nothing; protect highlights |
Colour film: three curves at once
A colour film has three characteristic curves – one per layer (R, G, B). For neutral colour they must stay parallel and matched across the whole range. Where they don’t match, you get colour crossover: a warm cast in the shadows and a cool cast in the highlights (or vice versa), which is impossible to fully correct because it needs opposite adjustments at each end.
Well-matched, low crossover: Portra, Ektar (within its contrast), Provia.
Deliberate curve shaping: Velvia’s curves are steep and slightly divergent for saturation; the pushed-tungsten look of CineStill 800T shot in daylight is partly curve mismatch.
The orange mask on colour negative (see How colour film works) is there precisely to correct one such mismatch – unwanted absorption by the cyan and magenta dyes – by adding a compensating coloured positive image into the base.
Fun fact
Hurter & Driffield published the curve in 1890 and were promptly attacked by pictorialist photographers who felt that reducing art to “two foreigners’ arithmetic” was vulgar. Their names survive in “H&D curve” and, indirectly, in the old sensitometric speed unit. Ansel Adams’s Zone System (1940s) is essentially the H&D curve translated into something you can use with a spot meter in the field.
Where to go next
Latitude, contrast and dynamic range – dynamic range and latitude read off this curve.
Pushing and pulling film – moving the curve on purpose.
Metering and exposure in practice – the Zone System, which is this curve in the field.